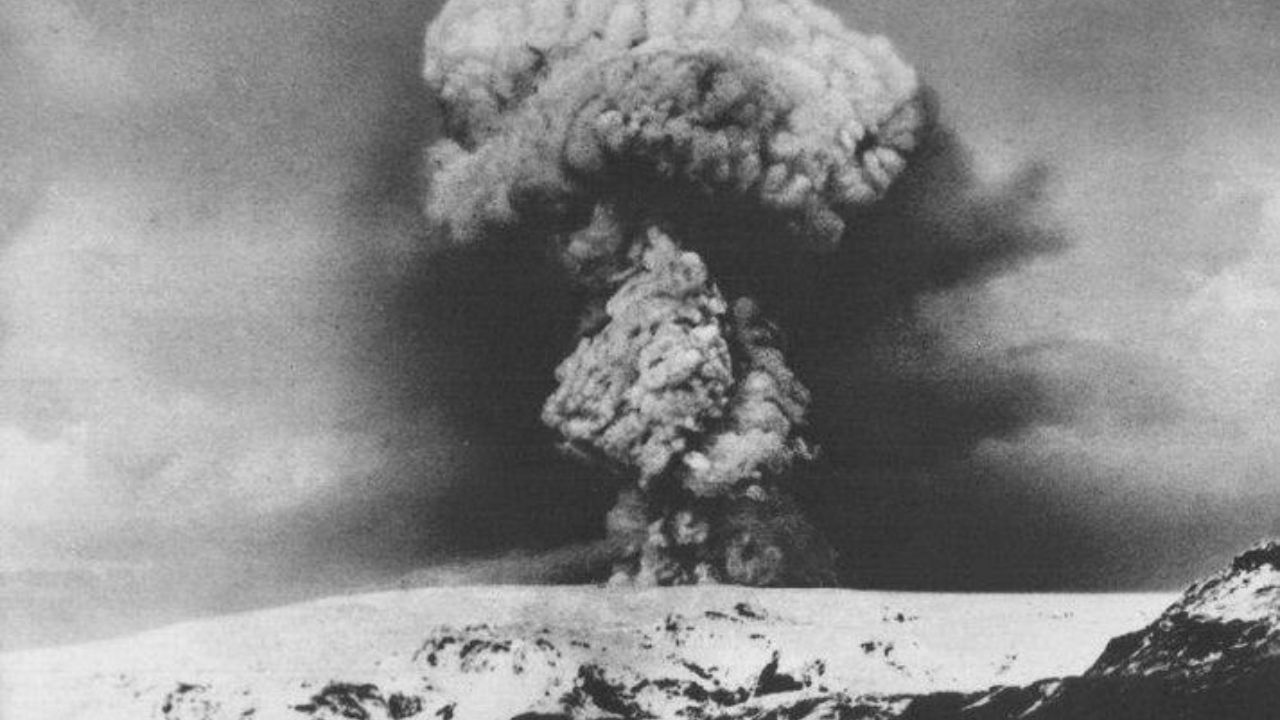
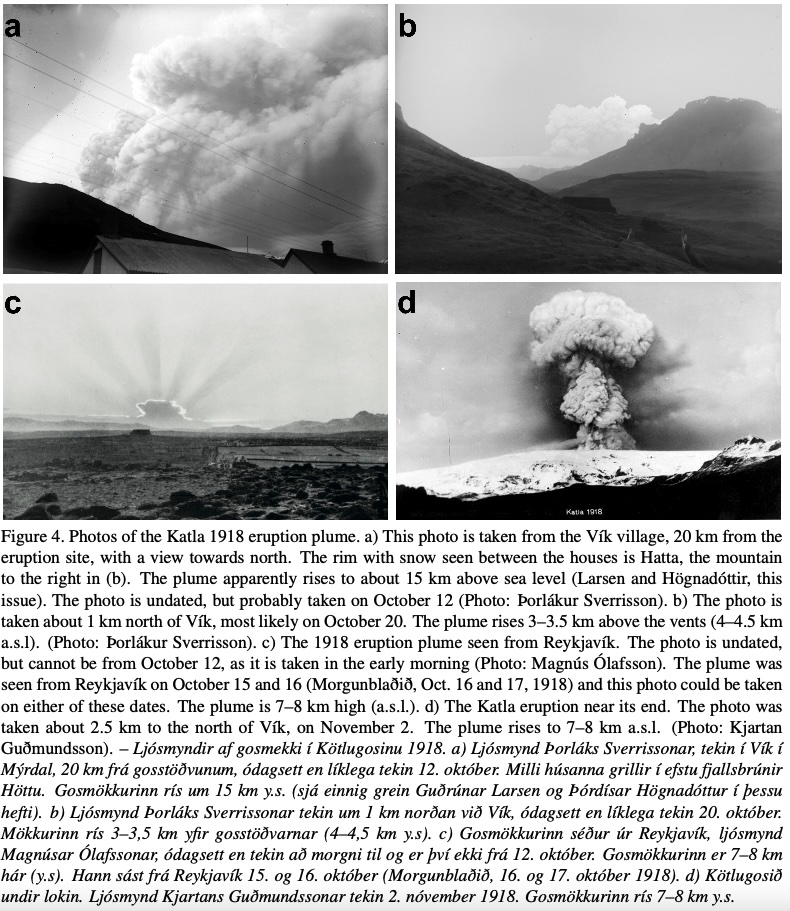
The most famous photo of the 1918 eruption of Katla
October 12, 1918 was just another Saturday. On the fields of France, the Hundred Days Offensive was turning a war which would now soon end, but leave 17 million dead; the devastation would set the scene for an even worse war to come. Far away, Puerto Rico lay in ruins after a magnitude-7 earthquake on the previous day: the damage had been compounded by a 5-meter tall tsunami arriving just minutes after the main shock. In Minnesota on that Saturday, 450 people died in large forest fires which had been set off by sparks from passing trains. And back in Europe, what was called the American flu, also known as Flanders flu (and to be renamed Spanish flu in order not to antagonize the American soldiers), was in its deadly second wave. A children’s rhyme had become popular: I had a little bird\\ its name was Enza \\ I opened the window,\\ and in-flu-enza. In Iceland, everything seemed calm – the flu would not arrive here for another week (on the same day as the independence referendum). The pandemic would soon turn Reykjavik into a ghost town, but that was still weeks away. And October 13 would be a day of darkness in Reyjavik.
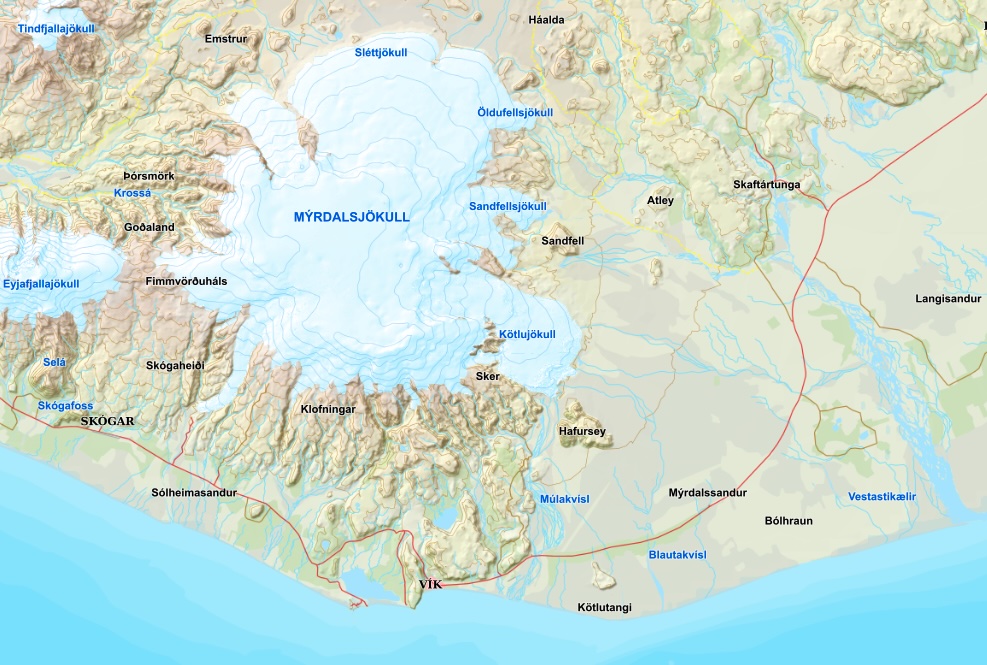
Vik is a small, ancient fishing town on the south coast, just west of the ‘land between the mountains’ which we wrote about before. The name means ‘bay’ – because it was the oldest, no further detail was needed, unlike those lesser ones called Grindavik or Reykjavik. Vik has the reputation of being both the warmest and wettest town in Iceland. Its climate is attributed to the influence of the Gulf stream – it is, after all, the southernmost town on the main land. The nearby beach of black sand, Reynisfjara, is famous. You may have seen it in the Rogue One movie. Out at sea, a series of rock stacks show the remnants of an old cliff, now largely removed by the stormy post-ice-age seas. Three of the stacks form the Reynisdrangar, appearing as (and reported to be) three frozen trolls. Invariably, black-sand beaches (and trolls) are a sign of danger. Indeed, 20 kilometer to the north lies Katla: the town was well familiar which its infrequent eruptions (perhaps twice per century) and its somewhat more frequent jokulhlaups, although to some degree protected from both. Katla, of course, is the source of that black, basaltic beach.
Guðrún Larsen (see references) recounts a story of that Saturday, more than a century ago:
Lilja Tómasdóttir (1906–1973), was 12 years old in 1918 and lived with her parents in Vík. On the morning of October 12 she had been washing clothes with her mother (Margrét Eiríksdóttir, 1867–1950) by the small river that runs through the village. At about 11:30 AM she noticed that there were small ripples on the surface of the water in the tub they were using. Her mother then said: “Guð hjálpi okkur, ætli Katla sé að koma?” (God help us, could this be Katla coming?) At 3 PM they had lunch. As the family sits by the table, a man comes and shouts: “Katla er að koma” (Katla is coming). Lilja then ran up the slope above the house and looking east saw the jökulhlaup burst forth carrying large blocks of ice, west of Hjörleifshöfði, 8–10 km away (Larsen’s source was Erlingur Ísleifsson, son of Lilja, 30th of January 2001).
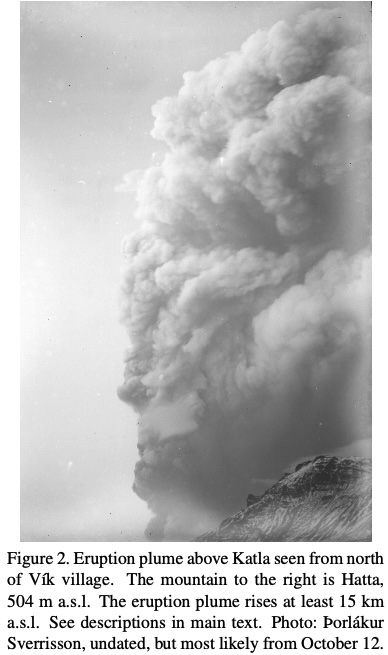
In between, people in Vik had felt a stronger earthquake at 1pm , followed by half an hour of small earthquakes, probably tremor. (Another report from that day gives 1 hour duration for the tremor.) Around this time, people in Mýrdalsandur started hearing the sound of rushing water. And at 3pm, a large cloud quickly rose from the glacier, seen by people in Vik, in Mýrdalur (the ‘boggy valley’ just west of Vik) and at Hjörleifshöfði (the outcrop just north of the label ‘Kötlutangi’ on the map). The cloud was white at first, with the lower part black. One description gives it the shape of an inverted funnel above a large horizontal ring. It was seen as a ‘cloud above the clouds’ from the Vestmannaeyjar islands, 65 km away. From there flashes of light were seen, something we would now identify as volcanic lightning. The photograph of the cloud below is taken from Larsen et al. (2021).
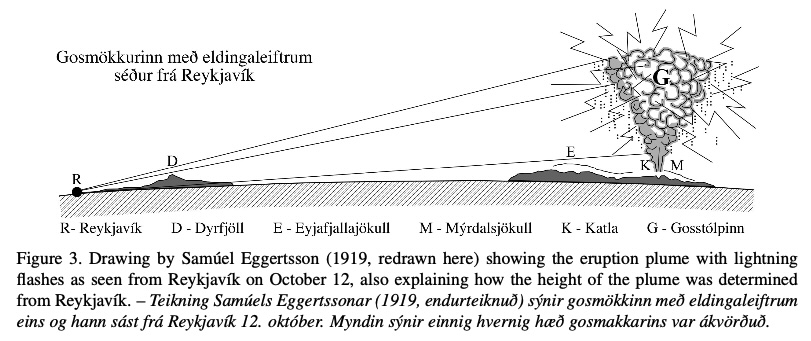
The plume was blown eastwards. By 3:30pm, ash was falling 30 km to the east-southeast of Katla, and by 8pm the ground in this region (Álftaver) was covered in black sand. During this time, as evening fell, the plume became more impressive with a red glow reflected of the lowest cloud. Lightning became incessant, being constant or at most a few seconds apart and lighting up the entire (visible) cloud. The plume reached 15 km height, but the lightning flashed upward to 20-25 km. A drawing of the height measurement done from Reykjavik is shown below, in a figure taken from Larsen et al.
In the evening, the wind became more westerly and the ash was now falling a bit further north, at Skaftártunga. By morning, 1cm of fine black ash covered the ground.
The next two days, the weather was not conducive to eruption watching, at least from a safe distance (which in the case of Katla is far outside its glacier, at least 20 km away). It was cloudy and hazy. The wind was now easterly and a thin layer of ash (less than 0.1mm on average) fell in Reykjavik as the skies there darkened. On Oct 14 there was some ashfall in the north of Iceland, but also in Vik. Ash and tephra was of course only reported from inhabited regions, mainly on the coast and not in the cente of Iceland or near Katla itself! Absence of reports does not mean lack of ash.
On Tuesday (Oct 15) the visibility improved: the cloud was now pulsing, growing higher and lower. The following days the plume was decreasing; it disappeared from view on Friday, Oct 18.
But this was not the end. On Oct 20, two plumes were visible, an eastern one and a weaker western one. It was now dark and clearly an ash cloud, and was lower than before. In the afternoon of Oct 21, the eruption intensified with eruption plumes and lightning similar to Oct 12: there had been another large explosion. Tephra fell again around northeast of Katla, less finely grained than the previous ash. This tephra was damaging: four farms in this region had to be abandoned. On Oct 22, the black ash cloud was higher than it had been before, and seemed to come from a vent further east than previously. This ash plume split into two ash columns on Oct 24, from the eastern and western vents. The cloud was blown towards Vik, which became completely dark: the reports say that windows looked as dark as the walls. Because of the danegrous lightning, the use of electricity in the town was not allowed. The ‘horrible black ash column’ was now stronger from the western vent. The ashfall lasted for 13 hours.
After this, the eruption diminished. The last tephra fell on Nov 1. The black column became ‘black smoke’ on Nov 2 and finally was described as ‘steam’ shortly after. Although some smoke was seen on Nov 10, the eruption was said to be over by Nov 4.
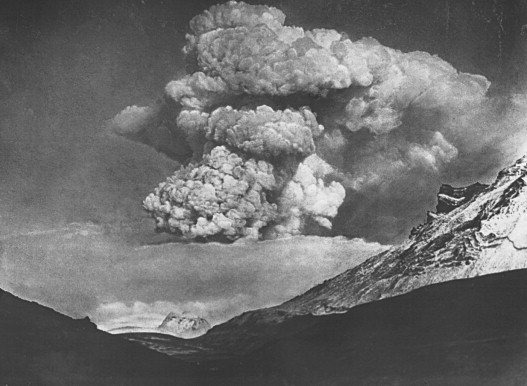
The most famous photos of the Katla eruption were taken towards the end, on Nov 2, when the column was less than 10 km high.These are panel ‘d’ below (Larsen et al. 2021) and the photo below (from Larsen 2010).
When the eruption had ended, the layer of ash was 1 cm thick 20 km from Katla in most directions, a bit more towards the north. Vik had 2 cm. It was thicker on the glacier, mostly 10-50cm. The total volume of tephra was a little over 1 km3.
Jokulhlaup
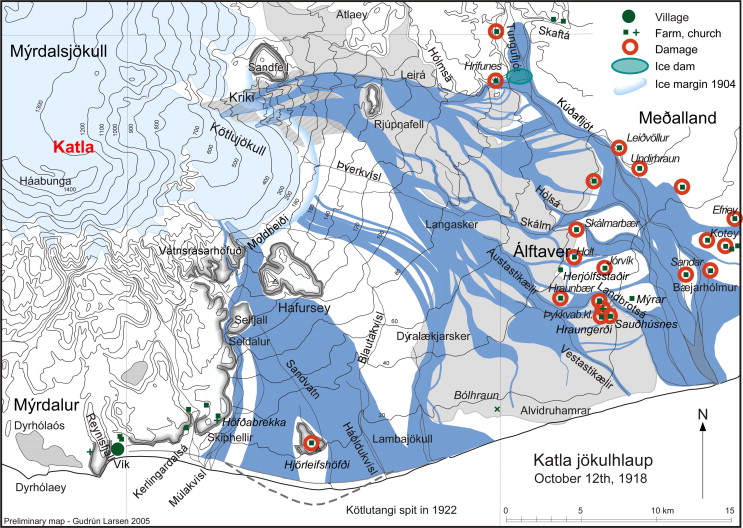
The flood paths of 12 Oct 1918
All Katla eruptions cause jokulhlaups along the river beds. They melt through large amounts of ice, and this has to go somewhere. Nowadays, the water escapes though a gap in the caldera wall towards the east and comes out along Kötlujökull, the eastern glacier. From there it runs off into several rivers, especially the Múlakvísl and Kúðafljót rivers and their tributaries. In the past, it would also om the other side of the caldera, but this has not happened since the Eldgja eruption in 939.
The flood that escaped the glacier around 3pm came down the Múlakvísl river. It far overwhelmed the capacity of the river bed and spread out across the Mýrdalssandur. The flow rate was a staggering 300 000 m3 /s at peak, with a mixture of meltwater, sediment and ice. (The sandur is in fact the deposits of such jokulhlaups which have deeply buried the soil below.) The flow reached the small hill on the sandur, Hjörleifshöfði, where one person, Kjartan Leifur Markússon, found himself surrounded on all sides. He estimated the speed of the flow as 20 km/hr – impossible to outrun.

Kötlutangi and Hjörleifshöfði. Source: https://guidetoiceland.is/connect-with-locals/regina/kotlutangi-spit-the-southern-most-point-of-the-mainland-of-iceland?
Other flows came down river beds to the east. Larsen (2021) provides a description from a 1919 report:
About 15 km east of the edge of Kötlujökull a group of farmers from Álftaver was waiting at a sheep pen on the north bank of the Skálm river for their farm hands that were herding sheep to the pen. Between 1 and 1:30 PM the farmers noticed an unusual humming sound coming from the west. The sound gradually grew louder and around 3 PM the youngsters in the group were sent home for safety’s sake. Shortly afterwards it became clear that a jökulhlaup was approaching along the Skálm river. The remaining farmers hastened across the river as a greyish-black wave of flood water, 2– 3 m high, was closing in “about 10 minutes away” from the ford. Although the herding farm hands made a narrow escape, no human lives were lost and all reached safety.
Afterwards, it was discovered that this flood had overtopped the Kötlujökull and had traveled on the surface of the glacier.
A second flood came around 5pm, perhaps from water traveling below the glacier. This seemed even larger, and carried so much ice that Kjartan Markússon described it as ‘snow-covered hills’. The flood was as much as 8 km wide! At this time, the flood in the Múlakvísl had ended, as it turned out because ice had blocked the stream bed. Off-shore, an icepack formed; on-shore, icebergs as tall as 45 meters (one report says 60 meters) were left behind.
The jokulhlaup continued on and off for weeks, even after the eruption had ended. The last flooding occurred on Nov 26. By that time, parts of the sandur had been raised by 5 meters or more.
(Was the jokulhlaup a lahar? A lahar is a mudflow, where between 20% and 50% of the volume consists of solid material, not water. More than 50% makes it a debris flow. In this case, sediment accounted for some 10% of the volume. So it was not a lahar.)
The jokulhlaup left a large canyon in the glacier, 1.5 km long, 500 meter wide and 100 meter deep. The flow dropped so much sediment that the coast was pushed out by several kilometers. This formed the Kötlutangi (‘Kötlu spit’) which now stretches south from the cliffs of Hjörleifshöfði.
This caused an unexpected consequence of the jokulhlaup. Before the change to the coast line, the southernmost point of the main land was at Dyrhólaey, near Vik. Now the new spit reached further south. And even though this spit has been steadily eroding ever since, it still extends further south than Dyrhólaey. On the most recent sentinel images, I measured it as 500 meters. At the current rate of erosion, that will last another 50 years before the baton is passed back.
Precursors
Waiting for Katla
Was 3pm on October 12 really the start of the eruption? The eruption had to melt through 400 meters of ice before it could burst into the open. This melt was probably what caused the tremor. The earthquake at 1pm was therefore the likely start of the eruption. Lilja Tómasdóttir’s description of the jokulhlaup shows that this had already broken through the end of the glacier at the time of the eruption cloud. This means there was only 1.5 hours between the first notable sign (ripples in a bath tub) and the major eruption! Even worse, when the cloud appeared, so did the melt water which rushed down the river valley.
So there was very little warning before the eruption, with only the slight trembling 90 minutes before the likely onset of the eruption. Is that common for Katla? Obviously, modern instrumentation might have picked up more indicators. But is the lack of notable earthquakes usual? Both Bardarbunga and Reykjanes gave us plenty of earthquake warning. Hekla did not, at least for recent eruptions.
Katla has erupted typically twice per century. There are usable reports of precursors after the 16th century. In 1625, Þorsteinn Magnússon at Þykkvabæjarklaustur wrote (text from Páll Einarsson 2019)
. . . Anno Christi 1625 on the second day of September early in the morning, around first light, a few earthquakes were felt here in Ver, small and not large. Shortly thereafter thundering noises and din were heard so strong that the Earth moved under our feet. Because the glacier first now (after the earthquake), together with fire and water, moved and exploded. But about the time milking was finished the river nearest to the farm began flooding. . . .
This is very similar to 1918, with moderate earthquakes shortly before the jokulhaup broke from the glacier. In the next eruption, in 1660, again there were similarities. This report is from Jón Salómonsson near Vik.
Anno 1660 on November 3, in the evening towards sunset, fire was seen erupting north of Höfðabrekka near Mýrdalur in Skaftafellssýsla district, with persistent earthquake for about an hour before the fire erupted, though with interruptions. Later that night, at the end of the working day, when people wanted to rest, a glacier outburst arrived at Höfðabrekka with tremendous and heavy water current, following the course of the Kerlingardalsá river east of Fagridalur.
The eruption in 1721 had stronger precursors:
Anno 1721 on May 11, at 11 h AM an earthquake occurred, so strong that people in Mýrdalur were afraid of staying inside their houses. This earthquake was also felt in Síða, in Eyjafjöll and Fljótshlíð. […] The same day at 1 PM, heavy noises with large cracking sound were heard, followed by terrible fire, column of smoke and fumes, that issued from the glacier north of Höfðabrekka, named Kötlugjá, … At 2 PM a flood of slush with a few icebergs flowed rapidly from the glacier … At 3 PM the real jökulhlaup arrived with great haste …
This report also states that the earthquakes continued for a week, with some activity until summer. While the onset was similar, the continuation was quite different.
In 1755 we have a familiar, reliable reporter: Jón Sigurðsson, from Laki fame, who would give the fire sermon in that eruption. At this time he lived in Holt, southwest of Katla.
…The events began on Friday, October 17, shortly before noon, with strong earthquakes, like houses were rocked, that lasted till the end of the day and the following night, so that many did not dare to stay inside their houses because of the movements of the ground and worries that the houses might collapse. In the evening of the same day at sunset frequent lightning was seen, that continued throughout the night together with tremors and movements of the ground. … In the night following October 17 and the day a flood and jökulhlaup originated in the so called Kötlugjá.
The eruption apparently broke out of the icecap on the Friday evening, as evidenced by the lightning. The earthquakes continued for a number of hours before the eruption; the tremor afterwards may have been the meltwater, attempting the break through the glacier at the depth of the little ice age.
In 1823, the earthquakes were weaker:
About 6 pm an earthquake was felt here in Vík (…), a few sharp and short shocks, but not hard enough to rock houses significantly, followed by weaker but persistent movements, later mixed with harder shocks similar to the first one, until 9h PM, then all became quiet for a quarter of an hour. Then an eruption column ascended at high speed … Near midnight … a water flood began, mixed with ice slush and glacier clay, east along the Víkurfjall mountain …
The 1860 eruption had a longer time between the earthquakes and the jokulhlaup:
On Tuesday May 8 at 6 to 7h AM earthquakes occurred large enough to shake houses and make cracking noises. At 5 1/2 h PM a jökulhlaup came down the Múlakvísl river with great speed …
These reports indicate that the sequence of events in 1918 is indeed typical for Katla, with earthquakes in the hours before the eruption, and jokulhlaups following after a few to 12 hours. There are a few hours of warning, which should be used well since when the water come it is too late for running.
Why is there no more warning? Many eruptions are preceded by weeks of earthquakes, but not here. Magma clearly does not have to do much rock breaking in Katla. There are a few options. First, all these were summit eruptions. Katla does do rift eruptions (Eldgja comes to mind) as well but has not done so recently. Unlike the other big beast volcanoes in Iceland, it only has one long rift, stretching for 70 km northeast. There is also a short rift going south, but this has not erupted since the ice age. Summit eruptions do not require long dikes, which removes one reason for long earthquake swarms. (The 1721 eruption may have activated a rift, from the continuation of the earthquakes, but the eruption remained confined to the summit.) Second, all these eruptions are basaltic. Katla has done silicic eruptions as well, with the large Vedde ash eruption as a good example, but even though these account for 5-10% of its eruptions, they have not happened in the last 1500 years. It is not clear, though, why this would be a reason for less earthquake activity. Finally, the magma may already reside at shallow depth, with the upper ground layers above it softened by the water percolating down from the ice cap – after all, this is among the wettest areas in Iceland. Katla is among the largest sources of volcanic CO2, constantly degassing even though it is not erupting: this also suggests that magma resides at relatively shallow levels. The large effusive Eldgja eruption occurred only 20 years after a normal Katla eruption: the deep large magma source which fed Eldja is apparently not affected by or directly involved with the summit eruptions.
The 1918 eruption was therefore in many ways typical. But the long time of quiescence is not. Katla eruptions tend to be spaced 40-60 years apart (apart from the minor phreatic explosions under the ice which happen on occasion), whilst it has now been over a century since the last one. There is no obvious reason for this delay. Global warming has affected Iceland, but it is not clear how that could affect Katla! (In the UK one would blame a lack of funding.) The most similar period was perhaps from 1500 onwards. Around 1500 Katla had a large eruption – it is not documented but there is a significant tephra layer from around this time. After that, there were small eruptions in 1580 and 1612, whilst the next major eruption was in 1625. Thus, the current interregnum could be similar to that period if the weak eruptions this time were too small to break through the ice.
Is Katla overdue? No volcano is overdue – eruptions do not occur on schedule. Neither is there much evidence for build-up of magma, apart from Katla’s tendency to emit quite a lot of CO2. The next eruption will remain unpredictable and will happen when we least expect it. It could still be 50 years away – but one day, someone in Vik will again see a ripple in the bathtub. A few hours later, the plume will rise and the waters will come. One day.

Albert, June 2024
References
The explosive basaltic Katla eruption in 1918, south Iceland I: Course of events, tephra fall and flood routes: Guðrún Larsen, Maria H. Janebo and Magnús Tumi Gudmundsson.
Jökull, No. 71, p. 1-20, 2021. https://jokull.jorfi.is/wp-content/uploads/2021/12/J71-1-20.pdf
Haukur Tómasson: The jökulhlaup from Katla in 1918. Annals of Glaciology, Volume 22, p. 249 – 254, 1996. https://www.cambridge.org/core/journals/annals-of-glaciology/article/jokulhlaup-from-katla-in-1918/6209392C96BF5A987B1E2E697B044C3E
Guðrún Larsen: Katla: Tephrochronology and Eruption History. Developments in Quaternary Sciences Vol. 13, 2010, p. 23-49, 2010
Páll Einarsson: Historical accounts of pre-eruption seismicity of Katla, Hekla, Öræfajökull and other volcanoes in Iceland. Jökull, No. 65, p. 35-52, 2019.


This article about the present and possible future of the Reykjanes peninsula eruptions was just released today (6/26/2024). There are some interesting summaries that are worth a read. Steve
https://onlinelibrary.wiley.com/doi/10.1111/ter.12733
thank you for posting.
Some results:
“The geochemical data presented here therefore support a common origin for the Fagradalsfjall and the Sundhnúkur magmas”
“the seismicity data provide information on when the magma transferred from the FVL to the SVL” – Between end of October 2023 and 10th November 2023 magma moved from Fagradalsfjall’s Volcanic Lineament to Svartsengi’s system, where the shallow spectacular activity followed.
I haven’t found any predictions about the future.
“Based on prior eruptive behaviour, this pattern is likely to continue for the coming centuries, posing considerable risk to the local population and important infrastructure on and adjacent to the RP (e.g. Keflavík airport, several geothermal power plants, popular tourist destinations, and population centres like Keflavík, Hveragerði, Þorlákshöfn, Grindavík, Vogar, Reykjanesbær, Suðurnesjabær and Greater Reykjavík.”
Last days we’ve had three interesting earthquake series ~50 km apart from each other:
1. an earthquake swarm near Reykjavik and Bláfjallaskáli on June 25th. There remains a risk for future eruptions close to the capital. They are related to Brennisteinsfjöll’s system
2. Yesterday a short swarm on the distant Reykjanes Ridge
3. Today three quakes on Eldeyjardrangur close to Reykjanestá
D : : D what woud happen if all Titans methane was splashed on earth and iginited? Instant venusian hell greenhouse? likley woud consume all the atmospheres oxygen too
Would probably be a greenhouse hell if it wasnt ignited too, just takes a bit longer for the sun to warm it up. Titan has higher air pressure than at sea level here, you wouldnt need a pressure suit at all there just something that can handle the cold. But I dont know if it physically has more atmosphere volume than Earth though.
My idea of what Kilauea is going to do, after now looking at the summit GPS, is as follows.
2024-2025 more eruptions on the SWRZ along the active rift. Lower volume but possibly very intense and extensive, possible ocean entry if big enough.
2025-2028 another rift opening, either on the ERZ connector or lower on the SWRZ maybe at Kamakaia. The latter could be voluminous, either a small shield or a curtain of fire. Probably stays active for a few years.
2024-2028 continued filling of the caldera with brief intense eruptions, possibly alongside a rift eruption. Small chance of a lake drainout.
2028-2030 some point in this range, after much inflation likely exceeding the 2018 value, the ERZ at Mauna Ulu opens. Likely a strong quake will result as the flank slides, but a lot smaller than 1975 or 2018. All summit and SWRZ activity stops and it all sppears quiet, while inflation and perhaps seismicity immediately begins at high rate between Pu’u O’o and Heiheiahulu.
2030 fissure eruptions begin east of Pu’u O’o. Might be a fires sequence like in the 1960s but it might be a one off big eruption. At some point an open vent remains on the rift, evolving into a lava geyser and a new shield. All activity elsewhere on the volcano is at a minimum outsude of inflation between fountains. Large fast flows to the ocean on the regular, with unfortunate property destruction.
Well this misplaced…
I also should add, all of the summit and SWRZ stuff might well happen within the next year at this rate. The start of the SWRZ connector is where inflation is strongest, it might intrude as a new dike into the open rift soon but might also just push through the connector and intrude a new dike at Kamakaia, most likely erupting. Unless it is a big eruption that stays open I dont see this stopping the inflation. To be honest I can see the current activity supporting eruptions at Kamakaia and the June 3 rift, and possibly going into the ERZ some point next year maybe immediately following eruptions on the SWRZ.
Really the big unknown is how long the supply stays this high. If one takes 1959 as an example, strong inflation started in mid September and the ERZ erupted 5 months later in mid January, despite a large summit eruption. The situation is a little different now, the SWRZ is open and the caldera is deeper. The start of the SWRZ is also the dominant inflation source not Halemaumau, so would seem logical to think that rift has first access. But its entirely possible the whole above sequence happens before the end of the year and we get Pu’u O’o Jr in 2025…
70 microradians at UWEV in 24 days, 3 a day. At the approximate conversion that is possibly 3 million m3 of magma a day, or a rate of over 1 km3 a year if it keeps going that long. Which is enough to fill the caldera to overflow if Pele were so inclined. But all prior episodes of comparable tilt, 1959, 1961, 1975, all resulted in flank intrusions, and either immediate major eruptions or a buildup to a long lived event. Seems likely the next chapter at Kilauea is imminent.
Can the intrusion lead to a combined Summit/SWRZ eruption? The SWRZ connector is not far away from the summit caldera. The relatively longterm eruption 1919-1920 happened when the summit had an active lava lake. It drained into cracks and fed the SWRZ eruption. Can anything like this happen in a shorter time frame than 1919?
https://www.volcanocafe.org/kilaueas-triple-swrz/
1919 wasnt from the SWRZ connector so I dont know if it works that way now. At least, the active rift now doesnt trend towards the caldera, and the faults dont align, so a single intrusion probably wont do it. But its possible to get multiple dikes where one might be in the caldera and another out on the rift, that is kind if what happened near Keanakako’i in 1971 and 1974 though the intrusions were small.
That being said the only example I can think of for an eruption at the same time on two different fissure swarms of Kilauea have involved intrusions occurring while Mauna Ulu and Pu’u O’o were still active. I dont think there have been eruptions that had two fissure swarms start erupting together at the same time, closest was in 1955 where one dike stopped erupting when another one uprift began to form and later erupted too, but not simultaneously.
There have been eruptions from parallel dikes close to each other, like at Alae and Aloi craters before they were buried.
There might be a possible exception to this in 1840, which involved vebts erupting from deep within the Koa’e all the way to north of Leilani Estates. But it was a weird eruption, and despite how it looks on the surface its not really clear if there were multiple simultaneous dikes from multiple origins or if it was just one massive complex intrusion. But the above point still holds for the post 1950 era, and I dont see an exception barring a major eruption which doesnt seem immediate.
What would we need/see to get an eruption like 1919-1920? This eruption was part of the “volcanic SWRZ”, fed by Halema’uma’u’s lava/magma. Can a fast summit eruption supply this lava storage in the Halema’uma’u area? 1919 the lava lake was a long-lived one. But can a short-lived one act the same way?
Keaiwa 1823 was also from Halemaumau, even though the Great Crack structure trends towards the rift connector. If you look at the area closely there is a graben that goes from the start of the volcanic SWRZ towards Pu’u Koa’e and I think this was from 1823. But that eruption was a massive drainout of a huge lake, like the one now but a lot more volume as it covered all of the caldera floor. The lake in Halemaumau now is probably deep enough to intrude into the SWRZ but it isnt voluminous or high up enough I think. That might not be the case in a few years possibly but I think it isnt likely as the next play.
“3 a day”.
Right now it’s going at 6 microradians a day, what in 2019 or 2020 might have been a month of inflation. Since mid-2023, deformation rates have been gradually increasing with a few pauses. But I don’t know where this might lead. I’m not even sure if there will be summit shield building or LERZ eruptions.
One thing is clear, Kilauea will soon fill the 2018 eruption deflation, at least for the South Caldera area, the most important storage of Kilauea. With not much more space to fill, if this supply keeps going, Kilauea will either throw a series of large dike intrusions in the UERZ or produce large amounts of effusion from either the summit or the ERZ downrift of Mauna Ulu. Mauna Loa is also inflating, slowly, but inflating. There will probably be a Mauna Loa eruption in a few years, as long as the supply doesn’t die down.
Yes 3 a day is just the average since the last eruption, its way above that currently. In that case the current supply rate might be closer to 2.2 km3 a year 🙂
Which, really, means we have only at most a few months before 2018 is but an afterthought on the charts. There are 3 options, the tilt slows, it doesnt slow and see prior comment, or it doesnt slow and actually doesnt erupt for a year and Kilauea promptly shows Iceland how to do a real flood lava…
I havent checked on Mauna Loa in a while, its quietness made me assume it was pretty deep asleep but its actually recovered to its 2020 level already. Which, considering it is clearly not in control of the magma source, is pretty crazy.
If that is right then in 6 years Hawaii has generated around 2 km3 of magma if not more. The entire yearly magma budget of Earth is about 20 km3, so 120 km3 since 2018. So Hawaii has been responsible for about 2% of all the magma on the planet in that time. Out of thousands of active volcanoes.
Can we follow the path of magma, that causes the present inflation? There must be a location at certain depth, where accumulating magma pushes the summit upwards. Maybe a big portion of the Pahala deep intrusions since 2019 has reached shallower levels in the island where it can induce significant inflation.
For Mauna Loa I was excpecting a Summit eruption that stays in the summit for next time. If this happens after five years, this will be around 2027-2028. A hundreds of days summit eruption needs a reservoir that can keep it running for this long time. For humans such an eruption would be no threat. In best case it might become a tourist eruption …
I dont think Mauna Loa can really do a tourist eruption, its too hard to get there safely without being experienced hiking at altitude. But the view from a distance would be nice, Mauna Loa eruptions are visible for hundreds of km, often from the other islands. Kilauea isnt so easy to see being where it is. Although glow from 2018 was seen from a long way.
I think possibly the Pahala swarm and tbe magma storage within it could have something to do with the magma surge now yes. The swarm was there before but it really flared up extremely after the 2018 eruption and supply rates at Kilauea have since increased significantly, especially now. But the actual quake swarm seems to be a fault plane, like the shallower decollement fault that the island slides on. Its complicated for sure.
Mauna Loa’s summit eruptions like 1949 and 1940 remained in the Moku‘āweoweo Caldera. The “Curtain of Fires” phase left the Caldera partially towards the SWRZ, but soon the eruption remained completely in the Caldera with a cinder cone eruption.
A description about the 1940 eruption: “on the evening of April 8, active vents were restricted to a fissure in the southwestern part of the caldera and remained there for the rest of the eruption. Activity outside the caldera lasted less than a day …. Throughout May, June, and July, the volcanic activity was intermittent, with periods of seeming quiet lava effusion followed by eruptive outbursts.”
From the Rim of Moku‘āweoweo Caldera this eruption would have been a great view.
In 49, 40, 33 and probably further back, ML summit eruptions parked at the SW corner for weeks or months. With 75 84 and 22, the focus was at the NWRZ and any activity at the SW corner was negligible and over with quickly.
Tutu Pele is fickle. 🙂
1935-1950 seems to have been a surge at Mauna Loa. It was also mostly during WW2 so information is a little scarce on activity outside of major flows. I am a little sceptical it was completely quiet between 1942 and 1949, I remember reading a bit about a plume above its summit in 1943 or 1945, which is a possible eruption.
Its also pretty obvious in the GPS that although the average Mauna Loa supply this past year and a half is high it was really high early 2023 and has slowed down a lot. Its still more than before the eruption but it seems to be mostly rebound. I think only after caldera collapse does the massive supply of decompression after an eruption actually translate to high eruptive activity, otherwise it seems to just shorten the gap to the next eruption.
I guess, summarizing, I dont think Mauna Loa can do a long eruption right now. It doesnt have the constant supply to keep the vent open like it did 80 years ago. The magma of 2022 was also lower in MgO than any other historical eruption, 6.6%, which is low for Mauna Loa which is usually 7-8%. Its still very mafic, but it suggests the magma isnt really fresh. It does also suggest it is a homogeneous chamber though so eruptions will probably continue to be voluminous and high intensity.
Between the last NERZ saddle (towards Mauna Kea) eruption 1935 and the following summit eruption 1940 was a break of five years.
1899 again was a NERZ saddle eruption, after which it lasted four years until the 62 days summit eruption 1903 occured.
1843 was a NERZ saddle eruption, after which 1849 a summit eruption (more than 27 days) followed.
I would classify the 2022 eruption again as a NERZ saddle eruption. If we look at the previous three eruptions of this type, after four to six years there followed summit eruptions. This would apply to the years 2026 to 2028.
Only 1843 was bigger than 2022, the other two NERZ saddle eruptions were smaller.
The last 4 eruptions on Mauna Loa have all been high intensity curtains of fire type eruptions though. One on the SWRZ starting from the pit craters and 3 on the ERZ but starting in Mokuaweoweo. Really Mauna Loa is basically two long fissures, they are parallel in the southwest summit area. One keeps going down the SWRZ while one goes through Mokuaweoweo and out beyond to the east. Its actually an interesting feature that Kilauea has too, that the dominant rift zone is not aligned with the caldera. Although Mauna Loas rifts are more equal.
Its also worth noting that although the magma supply has been generally low, 1950, 1984 and 2022 were all among the largest of Mauna Loas eruptions. 1950 was at least 0.4 km3, 1984 was 0.25 km3, and 2022 was 0.23 km3. And maybe more importantly all of these eruptions were fast and very intense at the start, all of them opened up 10+ km continuous fissures within hours of the start. 1975 was 1 day and 0.04 km3 but also still a 10 km fissure.
So 1950-present Mauna Loa has erupted about 0.92 km3 of lava, and only actually erupted for a total of 62 days in that whole time, an average rate of 14.5 million m3 a day. To compare to Holuhraun which erupted for 183 days and 1.6 km3, and 8.6 million m3 a day. Or Kilauea in 2018 which erupted 1.5 km3 in 128 days, 11.7 million m3 daily.
Also compare that to the 80 years before 1950 which saw Mauna Loa erupt on 2700 days in that time and a total of 2.68 km3, or an average of only about 1 million m3 a day. Which is still pretty high average for so long but nothing like recent activity. Theres a definite change, eruptions are rare and supply is lower, but the eruptions are larger and way more intense when they do happen.
I guess, to compare, Kilauea since 1950 up to present has erupted on 16137 days, and erupted 7.3 km3 of lava. Which is an average rate of 0.45 million m3 a day. So about half the rate Mauna Loas long eruptions do but it stays active way longer, and has erupted way more lava. It seems that it is just harder in general to erupt at Mauna Loa, it happens less often and less lava erupts there overall at least recently. But it has more force behind it.
My best guess is it is mostly elevation causing all of these factors, 3 extra km to go up. Its hard to push up that high, but what goes up must come down too and fast…
So 1950-now in Hawaii has erupted 8.22 km3 of lava, or about a rate of 0.11 km3 a year, a bit over 1 km3 a decade. If that is extrapolated roughly then since 1780 Hawaii might have erupted 25 km3 of lava. The estimated long term magma supply of Hawaii js 0.21 km3 a year, so about 52-53% of the magma made it to the surface since 1950.
Pu’u O’o-Ahu’aila’au eruption of 1983-2018 erupted 5.9 km3 total in 35.5 years. Average of 0.166 km3 a year. Or 79% of the hotspot output on average made it to the surface. For just Pu’u O’o it is 4.4 km3 in 35 years, 0.126 km3 a year, 60% of the hotspot erupted. So 1983-2018 there was 2.64 km3 of the hotspot that didnt erupt at Pu’u O’o. Although 1.5 km3 of that did erupt in 2018.
Compare to 2018-now and only 18% of the average hotspot rate has erupted at Kilauea. Although that does jump to 38% by including the Mauna Loa 2022 eruption. It is likely the magma supply after 2018 is higher than average though.
24 hour live UWB
This might be it! This tremor is stronger than the rest.
24 hour live HAT
24 hour live KKO
Shows up a bit on the other seismographs, albeit less so, but they do show up.
24 hour live RIMD
Kilauea INSAR up to June 20
http://www.mounts-project.com/static/data_mounts/kilauea10/2024/kilauea10_20240608T161642_20240620T161642_VV_ifg.png
Still no obvious uplift from the ERZ connector even though more of the quakes are there. Halemaumau also isnt really doing much surprisingly. Its all in the south caldera. I guess it has been another week but the trends on the instruments havent changed much in that time. Would be nice to have another tiltmeter on the SWRZ, SDH is actually too close and is probably being uplifted more than tilted at this point.
kilauea10_20240608T161642_20240620T161642_VV_ifg.png
Santa Barbara Volcano,
Terceira Island, Azores, Portugal.
The seismic swarms that have been occurring for two years and which have intensified in the last months, and signs of crustal deformation on the surface in a radial shape around the Santa Barbara caldera, have led the crisis office to conclude that we are in the presence of a magmatic intrusion and the alert system has been raised by one level.
https://www.ivar.azores.gov.pt/civisa/Paginas/all-bulletinSRPCBA.aspx?cy=:
I was wondering if they were ever going to raise the alert level. I suppose with an eruption from the Azores, the effusive bingo card will be completely
Santa Barbara is kind of both though. Its not that explosive from the way it looks but it is very bimodal. Theres a lot of trachyte in the caldera and nearby, but its last eruption in 2000 offshore was mafic, and the last eruption on land in the 18th century was mostly mafic but also made a chain of lava domes along a different fissure nearby on maps I have seen.
I guess, it would be like on La Palma in 2021, probably smaller though. But it could last for a while.
Added to this the islands there are small, so a lot of water-explosive potential.
If there is an eruption here, it would fit very well with the average time between eruptions there. Which is not an argument that it will erupt now
Azores like Iceland has the combination of MAR and a Hotspot. Did volcanism show similarities to Iceland there?
https://phys.org/news/2024-06-nasa-juno-probe-lava-lakes.html?fbclid=IwZXh0bgNhZW0CMTEAAR06bwglzbz8u0X_bwDkItRkVbXAWOEMf8qQZiWm5vTJ-3mxDYxwFSMuID8_aem_iyZx0C1NfzcLPTU7rPvcSQ
Another monsterious Ionian lava lake thermaly imagned… althrough not as big as the largest Ionian lava lakes
13 earthquakes in the past 2 hours…
The East Rift zone is swarming.
Tilt is now showing on the ESC tiltmeter on the East Rift connector. (Live).
PUHR with convex inflation:
They aim for the Chain of Craters. Is there already a dyke moving?
… and the swarm is over.
Or us it?
5 earthquakes in past 2 hours.
https://encrypted-tbn0.gstatic.com/images?q=tbn:ANd9GcSbbtwyPnl5szVF6LbEiWYhrv_B9UzbkAiw8Q&usqp=CAU
Map of the 1761 lava on Terceira island
Azores is souch a mindblowingly green place.. its just as green and cloudy as Hilo and Singapore but cooler and more pleasant over all. Their oceanic subtropical climate is the most pleasant that I have had of any vacation locale.. always mild and pleasant and tepid. Santa Barbara and Pico Alto Volcanic Complex have lots lots of pancake domes and blocky flows of trachytic peralkaline comenditic ryolites, blocky lava everywhere there is probaly a very large evolved magma body sitting in the teceira rift, earlier calderas and igmigbrites are good proof of that. Rifting events at Santa Barbara can throw out long lines of comenditic pancake lava domes
The Azores maybe show, how green the Sahara Desert once was during better climate conditions
Made a map of what I think Kilaueas magma system structure is, giving a basic idea of where eruptions start from. I had a similar map ages ago but lost it, this one is more up to date anyway.
https://i.imgur.com/0Wapd61.jpeg
Map of the major summit magma system and the rift connectors. Also showing the area of active south flank slipping as well as a section that isnt moving now but clearly does at times going further east. Last time that section moved might have been in 1960.
Summit, including SWRZ
https://i.imgur.com/S4IXiTX.jpeg
And SWRZ proper
https://i.imgur.com/qWpxtsM.jpeg
Chain of craters upper ERZ
https://i.imgur.com/y7VVnVt.jpeg
y7VVnVt.jpeg
Middle-lower ERZ, to the end of the current mobile flank zone
https://i.imgur.com/LjhpOT9.jpeg
LjhpOT9.jpeg
Lower ERZ and Puna Ridge. Technically, from a structural point of view 2018 wasnt on here except for fissure 17. But there are numerous eruptions that had dikes weaving between fissure swarms anyway.
https://i.imgur.com/ZIUApoi.jpeg
And all of the above combined
https://i.imgur.com/04WdCfq.jpeg
It seems Imgur images dont display anymore, even directly copying the image URL.
Lower ERZ can occasionally do Surtseyan eruptions. I think I once have read about an event, when a collapse in the Summit Caldera was followed by an offshore LERZ Surtseyan eruption. 1924 HVO writes about a “submarine lavaflow” during the explosive caldera collapse. Maybe this was an effusive (Pillow Lava), but in other cases can be Surtseyan.
Change the jpeg extension to jpg
And all of the above combined
Thanks 🙂
It might be an imgur thing then, loading the URL as the .jpeg rather than the .jpg. It used to just load the links directly as they were from the URL. Either that or its how the forum handles it has changed slightly at some point.
I believe that it is imgur that changes the link to the embedding page
Great work! thats also the ideas that I more or less had in mind looking at the numerous eruptions intrusions and their locales.. Kilauea is a big lovely thing… althrough sadely not a scandinavian volcano : (
Nice map!
This is the connector seismicity downrift of Mauna Ulu, showing the internal plumbing of the ERZ. The connector is somewhat detached southward from the surface expression of the rift because, downrift of Napau, the dikes are inclined, except those that come from Napau itself, which are subvertical:
And this is the upper part of the connector plumbing:
09:26 The Svartsengi cone is smoking.
New post is up! A walk in the park
https://www.volcanocafe.org/run-volcano-run/